


The Associated Press’ NCAA Basketball Preseason Poll has a dual nature in that, it is both meaningful and not meaningful simultaneously. Every year the poll comes out creating a buzz about who should be higher and who should be lower. As with any preseason poll, power ranking or vote basis is complete speculation. So why should you care? Aside from bringing attention and excitement at the approaching season what does it provide us with? History shows that the AP Preseason Poll provides us with a gaze into the future and that we should give it significantly more attention.
Every year in the NCAA tournament brings with it new surprises, bigger upsets and more underdogs advancing. However, the trends found between the AP Preseason Poll and the NCAA Tournament can’t be ignored.


To begin, a high volume of teams appearing in AP Preseason Poll make the NCAA tournament. The 2015-16 season preached having no definitive power. Still, only one team in the preseason Top 25, LSU, did not make the Big Dance. Over the past ten years, an astounding 85 percent (214/250) of teams in the preseason poll make it to March Madness. In addition, two teams counted against the percentage were Syracuse in 2014-15 and Connecticut in 2012-13. Syracuse made a self-imposed ban so they became ineligible. UConn became ineligible due to Academic Progress Reports. Removing those two blemishes moves the 10-year average to 86 percent. Even the most inaccurate year, 2009-10, was still extremely predictable before the season began. Essentially, the Associated Press is able to make an educated guess about one-third of the NCAA field before the season begins.
| Percentage of Teams in AP Preseason Poll to Make Tournament | |
| Year | Percentage |
| 2015-16 | 96% (24/25) |
| 2014-15* | 84% (21/25) |
| 2013-14 | 92% (23/25) |
| 2012-13^ | 84% (21/25) |
| 2011-12 | 84% (21/25) |
| 2010-11 | 92% (23/25) |
| 2009-10 | 72% (18/25) |
| 2008-09 | 80% (20/25) |
| 2007-08 | 92% (23/25) |
| 2006-07 | 80% (20/25) |
| *=Syracuse self-imposed ban. | |
| ^=Uconn APR ban. | |
Not only do they predict who the teams who will be in the tournament well, but in general they are able to identify the very best teams in the tournament. At the end of the year, out of 350-plus teams, we watch four play in April. The majority of those teams are included on the AP’s radar.

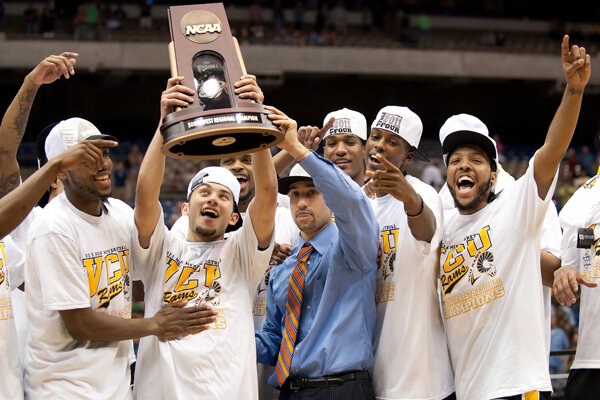
Over the past decade of basketball, an average of 90 percent of the Final Four has appeared in the poll. Only four teams in the decade were not in the poll, but made the Final Four. Two of them were the surprising runs of VCU and Wichita State to the Final Four in 2011. The poll of the 2007-08 preseason contains a nice surprise. The top four teams in the poll are the four teams that made the Final Four. That was also the only year since tournament expansion that all four Number One seeds made the Final Four.
Moreover, 81 percent of the teams in the Elite Eight and 68 percent of teams in the Sweet 16 made appearances in the poll. Every year, of course, there are schools like Davidson that make a run. It is difficult to predict those runs during your bracket challenge in March, but the point is, the AP has their finger on the best teams in October.
| Teams in Each Round that Appeared in AP Preseason Poll | |||
| Year | Final Four | Elite 8 | Sweet 16 |
| 2015-16 | 75% (3/4) | 75% (6/8) | 75% (12/16) |
| 2014-15 | 100% (4/4) | 87% (7/8) | 68% (11/16) |
| 2013-14 | 100% (4/4) | 87% (7/8) | 68% (11/16) |
| 2012-13 | 75% (3/4) | 75% (6/8) | 62% (10/16) |
| 2011-12 | 100% (4/4) | 100% (8/8) | 87% (14/16) |
| 2010-11 | 50% (2/4) | 62% (5/8) | 62% (10/16) |
| 2009-10 | 100% (4/4) | 75% (6/8) | 62% (10/16) |
| 2008-09 | 100% (4/4) | 87% (7/8) | 75% (12/16) |
| 2007-08 | 100% (4/4) | 75% (6/8) | 62% (10/16) |
| 2006-07 | 100% (4/4) | 87% (7/8) | 62% (10/16) |
Not only does the AP know about the best teams, but also about the best team. In the past decade, only three champions began the year outside the top ten. Only one began the year unranked. Having the champion ranked at the top spot twice shows that the writers have a deep insight. The average rank for the champion in the preseason, not including the unranked Huskies in 2011, is 5.7.
| Preseason Ranking for Champion | ||
| Year | Team | Rank |
| 2016 | Villanova | 11 |
| 2015 | Duke | 4 |
| 2014 | Connecticut | 18 |
| 2013 | Louisville | 2 |
| 2012 | Kentucky | 2 |
| 2011 | Connecticut | NR |
| 2010 | Duke | 9 |
| 2009 | North Caroilna | 1 |
| 2008 | Kansas | 4 |
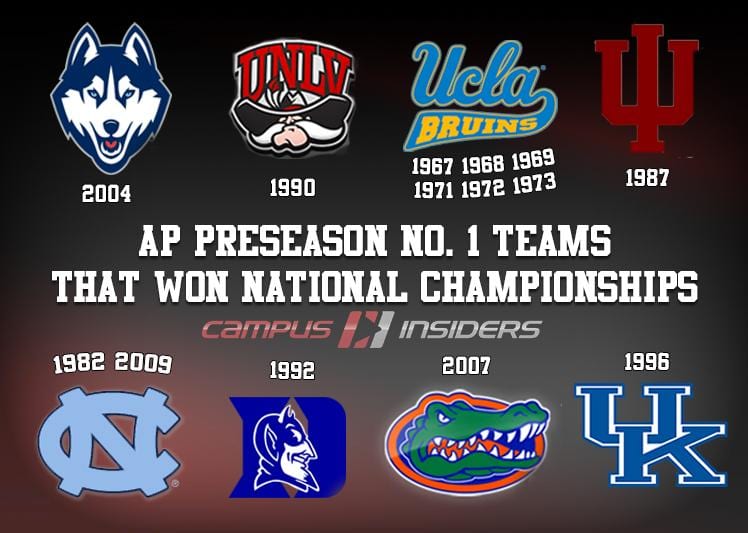
| 2007 | Florida | 1 |
While the Associated Press may not always rank the Final Four as the top four teams, this is still impressive. The AP shows the ability to weed out the teams not up to par before teams play their first game. This is weeks before teams have even scrimmaged or had an exhibition.
In the next month or so, the AP will release the 2016-17 Preseason Poll. This ranking should be given serious consideration. Remember that history proves this ranking to be quite informative.